Idaho Power is proud of our diverse energy mix. See the charts below to compare Idaho Power’s energy sources with the national average.
Idaho Power 2025 Energy Mix
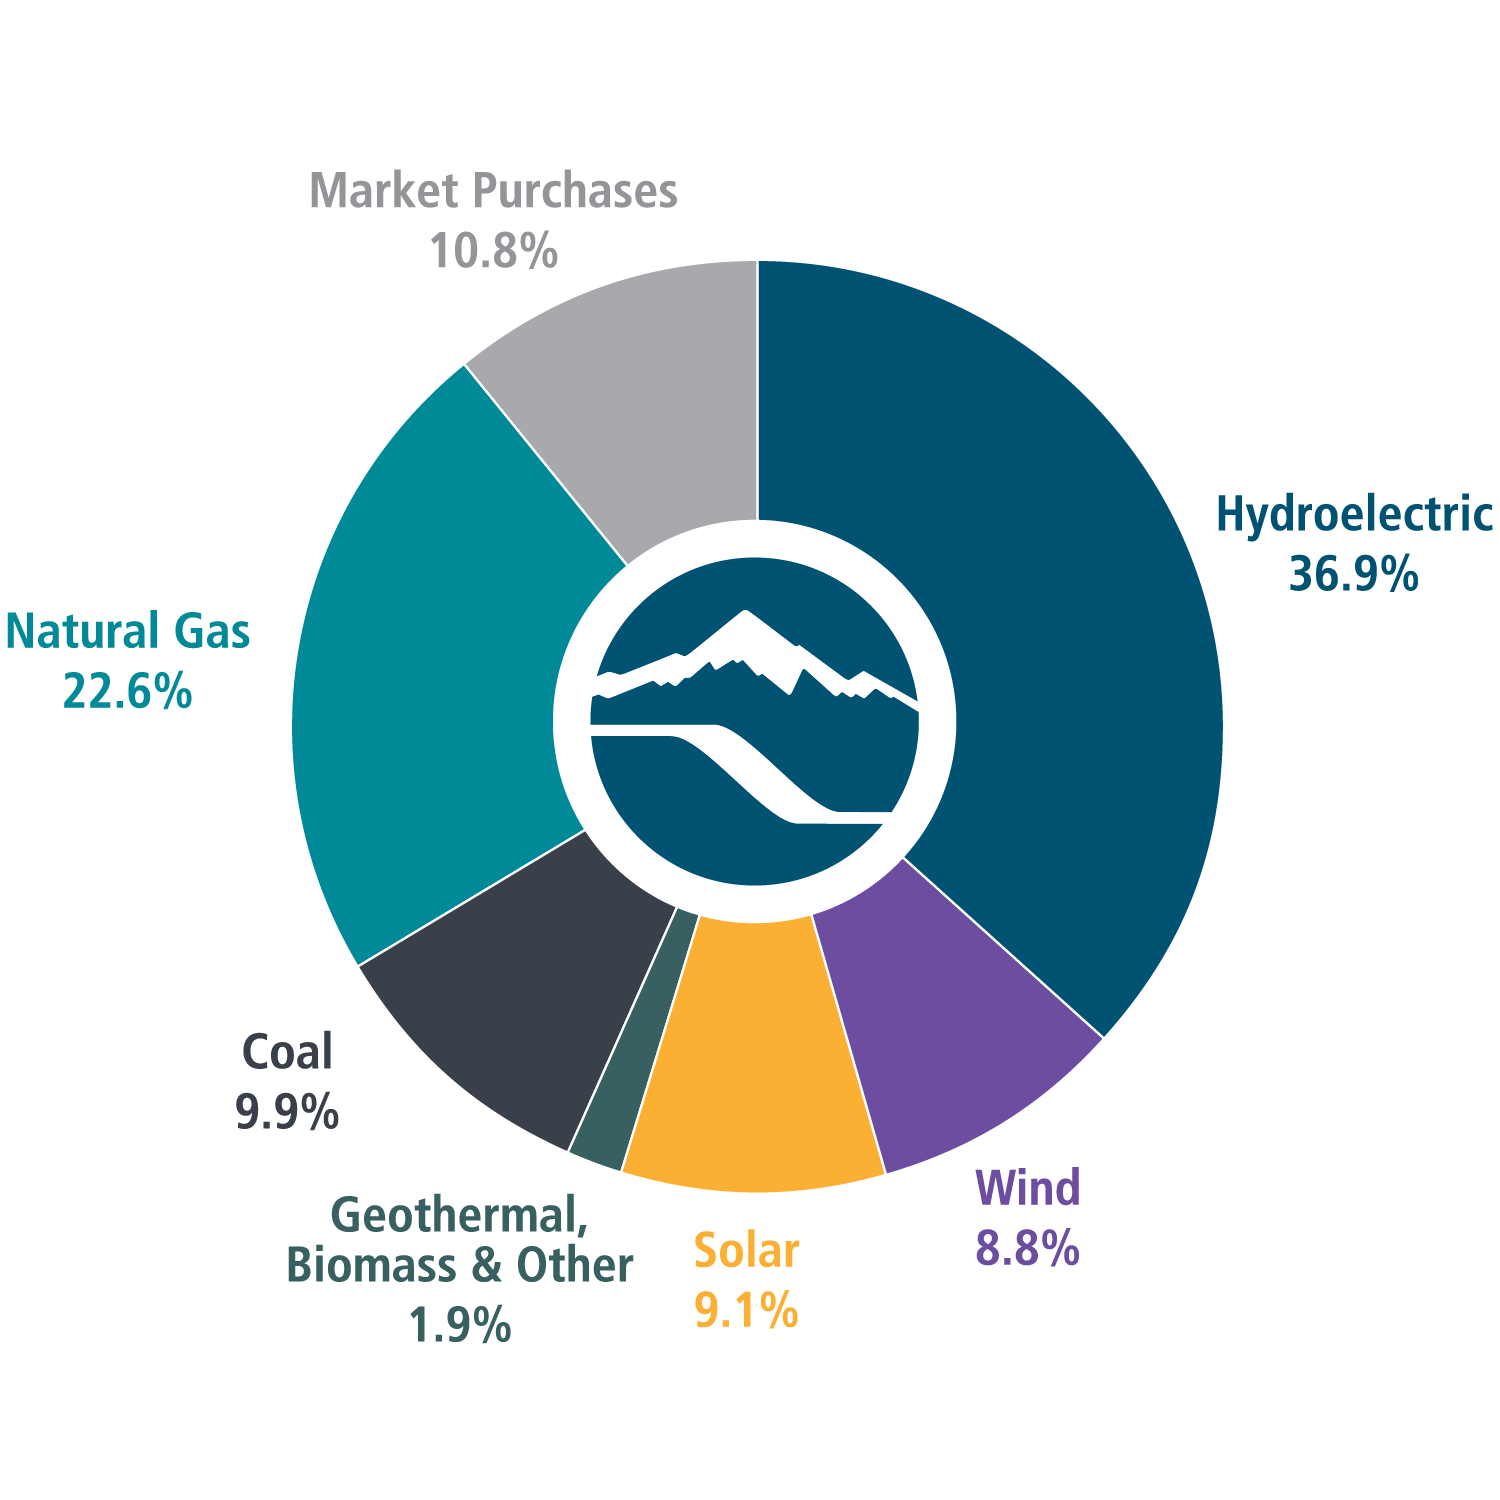
This chart shows Idaho Power’s sources of energy, which do not reflect energy delivered to customers for two reasons. First, we participate in the wholesale energy market and sell energy both to other utilities and retail customers. Second, power from some renewable sources comes with a Renewable Energy Credit, or REC. We sell the majority of our RECs to help keep customer prices low, and reserve only enough RECs to cover 5-10% of Oregon customers’ electricity consumption for compliance purposes.
National Energy Mix Average 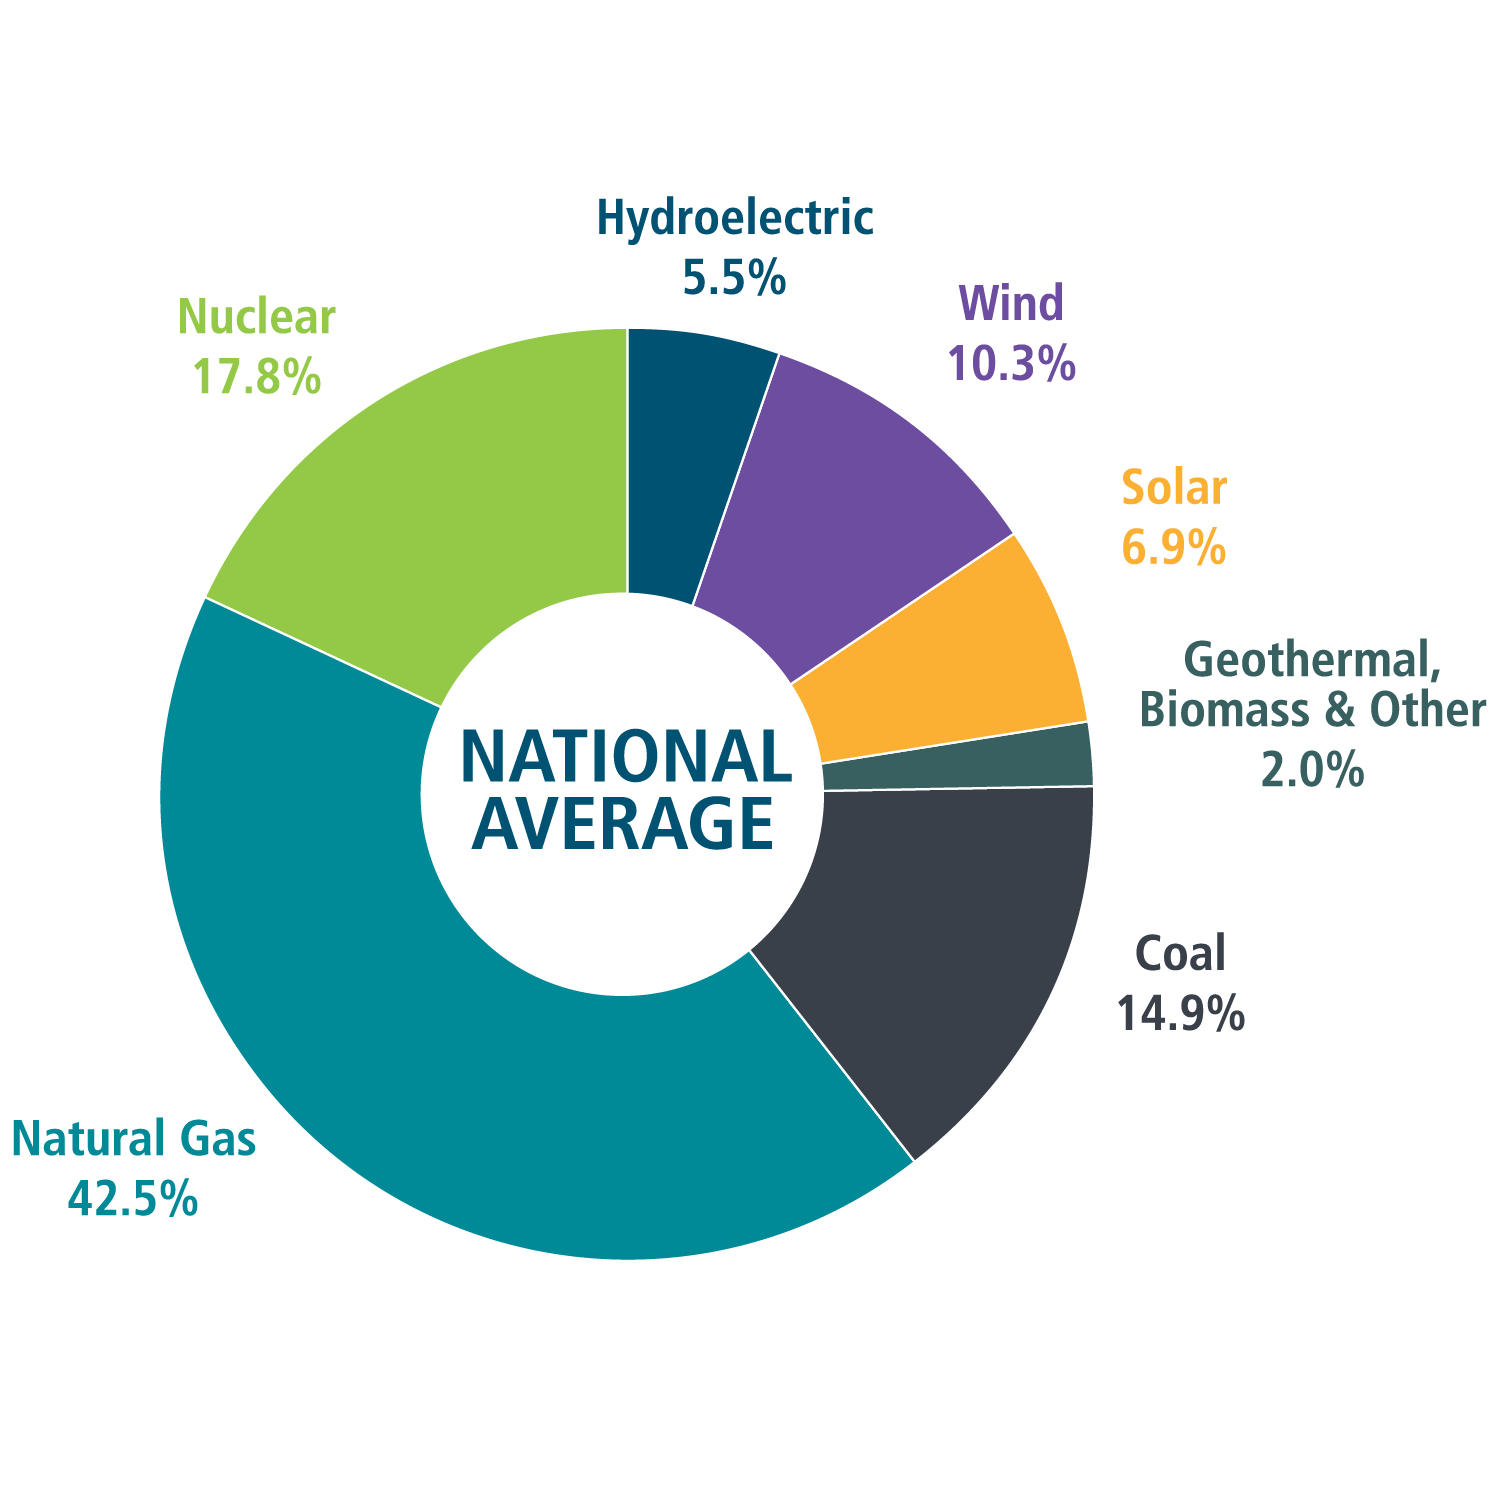
Data Source: U.S. Energy Information Administration